
We often look at valuations in the high yield market by analyzing the spread over a risk free rate, which is generally a comparable maturity Treasury bond. Here’s a look at where we have been historically versus where we are today:1
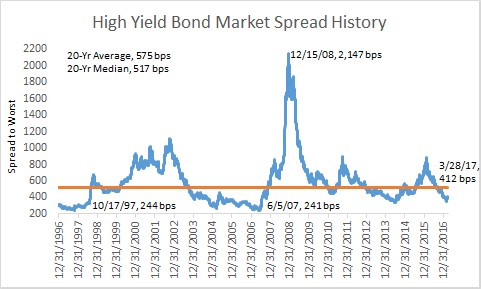
Over the past 20-years, the average spread has been 575bps, however that includes the massive widening of 2008 when spreads shot up as high as 2,147bps; thus we feel looking at the median 20-year value of 517bps is more appropriate. Today we sit about 100 bps inside that 20-yr median, with our current spread level of 412bps, so we are currently below the median but still well above historic lows hit of sub-250bps both in mid-to-late 1997 and mid-2007.
Similarly, if we look at spreads in investment grade corporate bonds over the same period, we see that we are at a spread level currently of 123bps versus a historical average of 158bps and median of 145bps.2
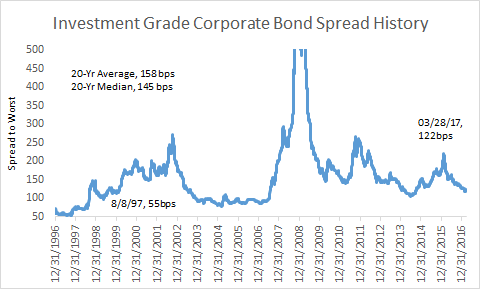
So again, here we are below the historical averages and medians, but above the lows of 55bps in mid-1997. However, the high yield market currently has a nearly 300bps spread advantage versus investment grade bonds, which is a notable advantage in the currently low yield environment.
Turing to equities, we see elevated valuations. Here, the history extends back decades, so let’s look at the last 50 years.3 Over this period, we have seen only one time that Shiller PE Ratios have surpassed current levels, and that was back in the Internet bubble of the late 90s.
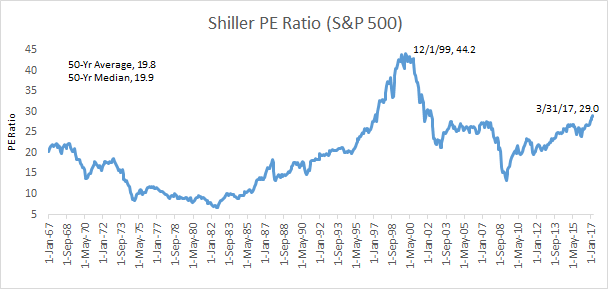
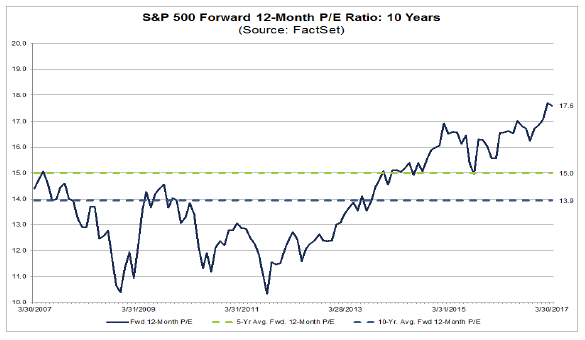
While the chart above looks at the price earnings ratio based on average inflation adjusted earnings from the previous 10 years, even if we look at forward 12 month PE ratio for the S&P 5004 we come to the same conclusion that current equity valuations are well above levels we have seen over the last decade.
So while none of these asset classes appear “cheap” by these historical average and median levels, it does appear to use that that there is still some value in the high yield market relative to these other asset classes. Equities are getting back to valuations we last saw during a bubble and the highest valuations in over a decade. While time will tell if and when these valuations normalize, we do struggle to see catalysts to send them higher. If anything, we believe equities have gotten ahead of themselves and priced in the benefits from the Trump-administration policy changes, tax declines, infrastructure spending, and strong economic growth. However, so far we are seeing an administration that is stalled in following through on these measures, so we feel there is more downside should some of these initiatives appear to not come to fruition.
On the investment grade corporate bond side, this asset class does carry a high duration (a measure of interest rate sensitivity), so should we see much of a move in rates, we would expect this asset class to be more susceptible, not to mention the low yield this asset class currently offers investors.
High yield spreads are below historical averages, but that largely makes senses given the outlook for the biggest risk we see—defaults—is also below average (see our piece, “Spreads, Oil, and Finding Value in the High Yield Market”). While the high yield bond market certainly isn’t as “cheap” as it was a year ago, there is still what we see as attractive spread and yield in selective credits and we are working to capitalize on that value for investors.