
The high yield market, also known as the “junk bond market” seems to be considered by many to be a risky and volatile, niche market. The reality is that there are nearly $2 trillion US dollar, non-investment grade bonds globally.1
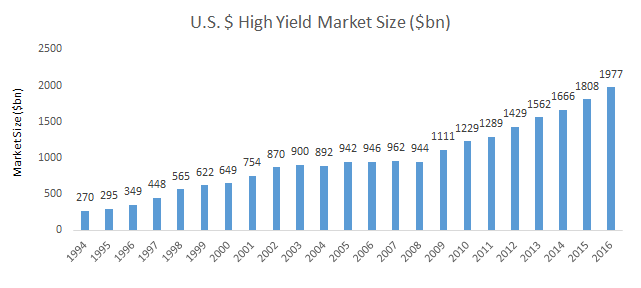
So certainly not a tiny, niche market. This is a large and growing market, owned by retail (mutual fund and exchange traded fund) and institutional investors, insurance companies, pension funds, and foreign investors.
On the volatility side, yes high yield bonds are more volatile than their investment grade corporate debt counterpart, thus would be considered more “risky,” however, with that comes the higher yield (as the name suggests) and historically better return profile for high yield bonds, or non-investment grade bonds, versus investment grade2. However, high yield bonds have historically had significantly less volatility/risk than equities. For instance, last Wednesday, when we saw equity markets take a hit, with the S&P 500 down -1.79%, the high bond index was down -0.11%.3
While one day certainly doesn’t paint a complete picture, we have a 30 year history that does. Over various periods over this 30 years, we have seen a much lower volatility (standard deviation) for the high yield bond market versus equities (as represented by the S&P 500 index), all the while with a similar return profile.4
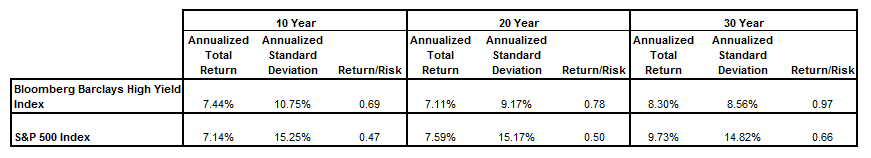
With this, high yield bonds have outperformed equities over these various periods on a risk adjusted basis (Return/Risk).
We believe that investors do themselves a disservice by dismissing the high yield market as “too risky” or “too small” and not considering including this market as part of the asset mix in their portfolio. Investors need to keep in mind the true risk profile of the high yield market as they consider their investment options.